Ever increasing environmental demands are being placed on energy generation, which is leading to diversification of energy sources towards building a low carbon economy. This is driving interest in battery technology and alternative energy sources, such as wind and solar, as well as increasing demands on improving traditional powers sources such as coal and nuclear.
Trend
Petroleum is the main source of energy in the United States. The liquid is predominantly utilized as a fuel in the transportation sector, which is also the second-largest consumer of energy in the US, with a proportion of over 28 percent of the country’s total energy consumption. Investment in the transportation sector also increases given the growing consumption. South Korea, China, US and Germany are the four countries that have the highest level of energy storage method deployed.
Table of Contents
Global Primary Energy Consumption by Source
The first KISS metric is global primary energy consumption by source. It is critical to understand energy consumption by source change with time so that we can understand the future of energy consumption.

Despite the prevalence of fossil fuels in the energy mix, the use of renewable energy sources has grown immensely in the last decade. Most of the renewable energy produced worldwide is derived from biomass, hydro and wind sources.
Global Primary Energy Consumption by Region
The second KISS metric is global primary energy consumption by region. As manufacturing centers are shifting toward Africa and South Asia, resulting in energy consumption growth in developing countries. It is interesting to see the relationship between energy-intensive manufacturing shifts and energy consumption worldwide.

Manufacturing centers are shifting toward Africa and South Asia, especially China and India, resulting in energy consumption growth.
Renewable Energy Investment
The third KISS metric is renewable energy investment. It emphasizes the opportunities for the energy system to attract the scale and types of investment that would align with a more secure and sustainable energy system.

Investment flows today determine where electricity comes from tomorrow. Increasingly, the money is flowing to renewable energy technologies. In 2019, the world financed $282 billion of renewable capacity, with onshore and offshore wind leading the way at $138 billion followed by solar at $131 billion. The success is attributable to maturing technologies and falling costs.
Energy use vs. GDP per Capita
The fourth KISS metric is energy use versus GDP per capita. Access to energy is a key pillar for human well being, economic development and poverty alleviation. Balancing the challenge between development and environment therefore provides us with an ultimate goal of ensuring everyone has access to enough sustainable energy to maintain a high standard of living.

The log model depicts the relationship between energy use and GDP per Capita. The positive relationship is clearly shown in developing countries.
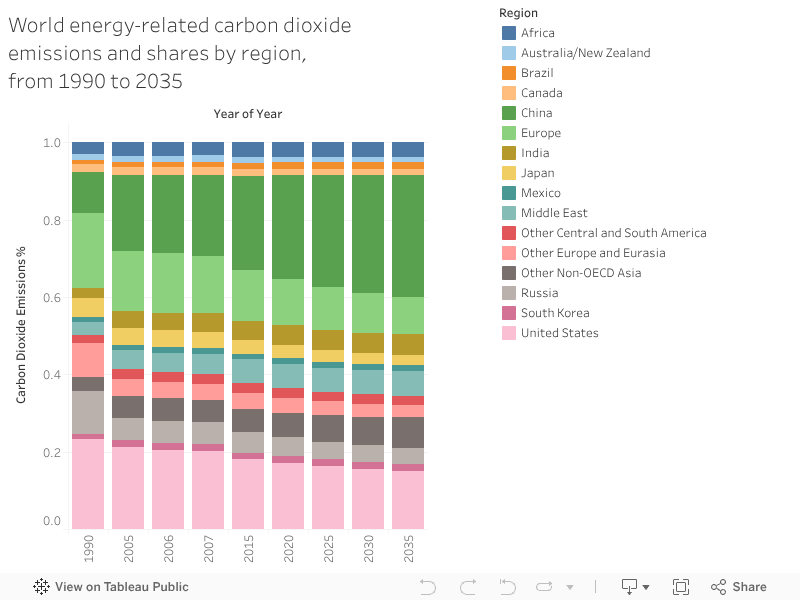
Greenhouse Gas Emissions Due To Energy Consumption
The fifth KISS metric is the greenhouse gas emissions due to energy consumption. Historical and current energy systems are dominated by fossil fuels which produce carbon dioxide and other greenhouse gases – the fundamental driver of global climate change. If we are to meet our global climate targets and avoid dangerous climate change, the world needs a significant and concerted transition in its energy sources. That’s why we picked green house gas emissions as an important indicator.

As people become more environmentally aware, the trade-off between GDP growth and carbon dioxide emissions occurs. Most energy-intensive manufacturing shifts to non-OECD Asia. The carbon dioxide emissions in non-OECD Asia continue to increase, which has driven concerns from the environmental prospective.
Electric Vehicle Sales
The last KISS metric is electric vehicle sales. As technological progress advances and the market for them grows, electric vehicles are expanding significantly. This goes along with the previous metric – greenhouse gas emissions. In 2019, indications of a continuing shift from direct subsidies to policy approaches that rely more on regulatory and other structural measures – including zero-emission vehicles mandates and fuel economy standards. The expansion of EV sharing systems also indicates that the transition in vechicle consumption will elevate in the future.

Deloitte estimated that EVs will represent 10% of the total automotive market share by 2024. The International Energy Agency (IEA) reports rapid growth in electric car deployment, particularly in China. The IEA forecasts thatEV stock would reach more than 250 million, reducing oil demand by an estimated 4.3 million barrels per day (mb/d).


One thought on “Energy Generation & Storage V1”
Comments are closed.